

Analytics: What Worked and Why
Updated: October 11, 2026 · 2 min read
The Analytics page shows how your social media is doing in numbers: how many people saw it, how many engaged, whether you gained followers, which platform and time work best. You base decisions on these numbers, not guesses.
Using the screen
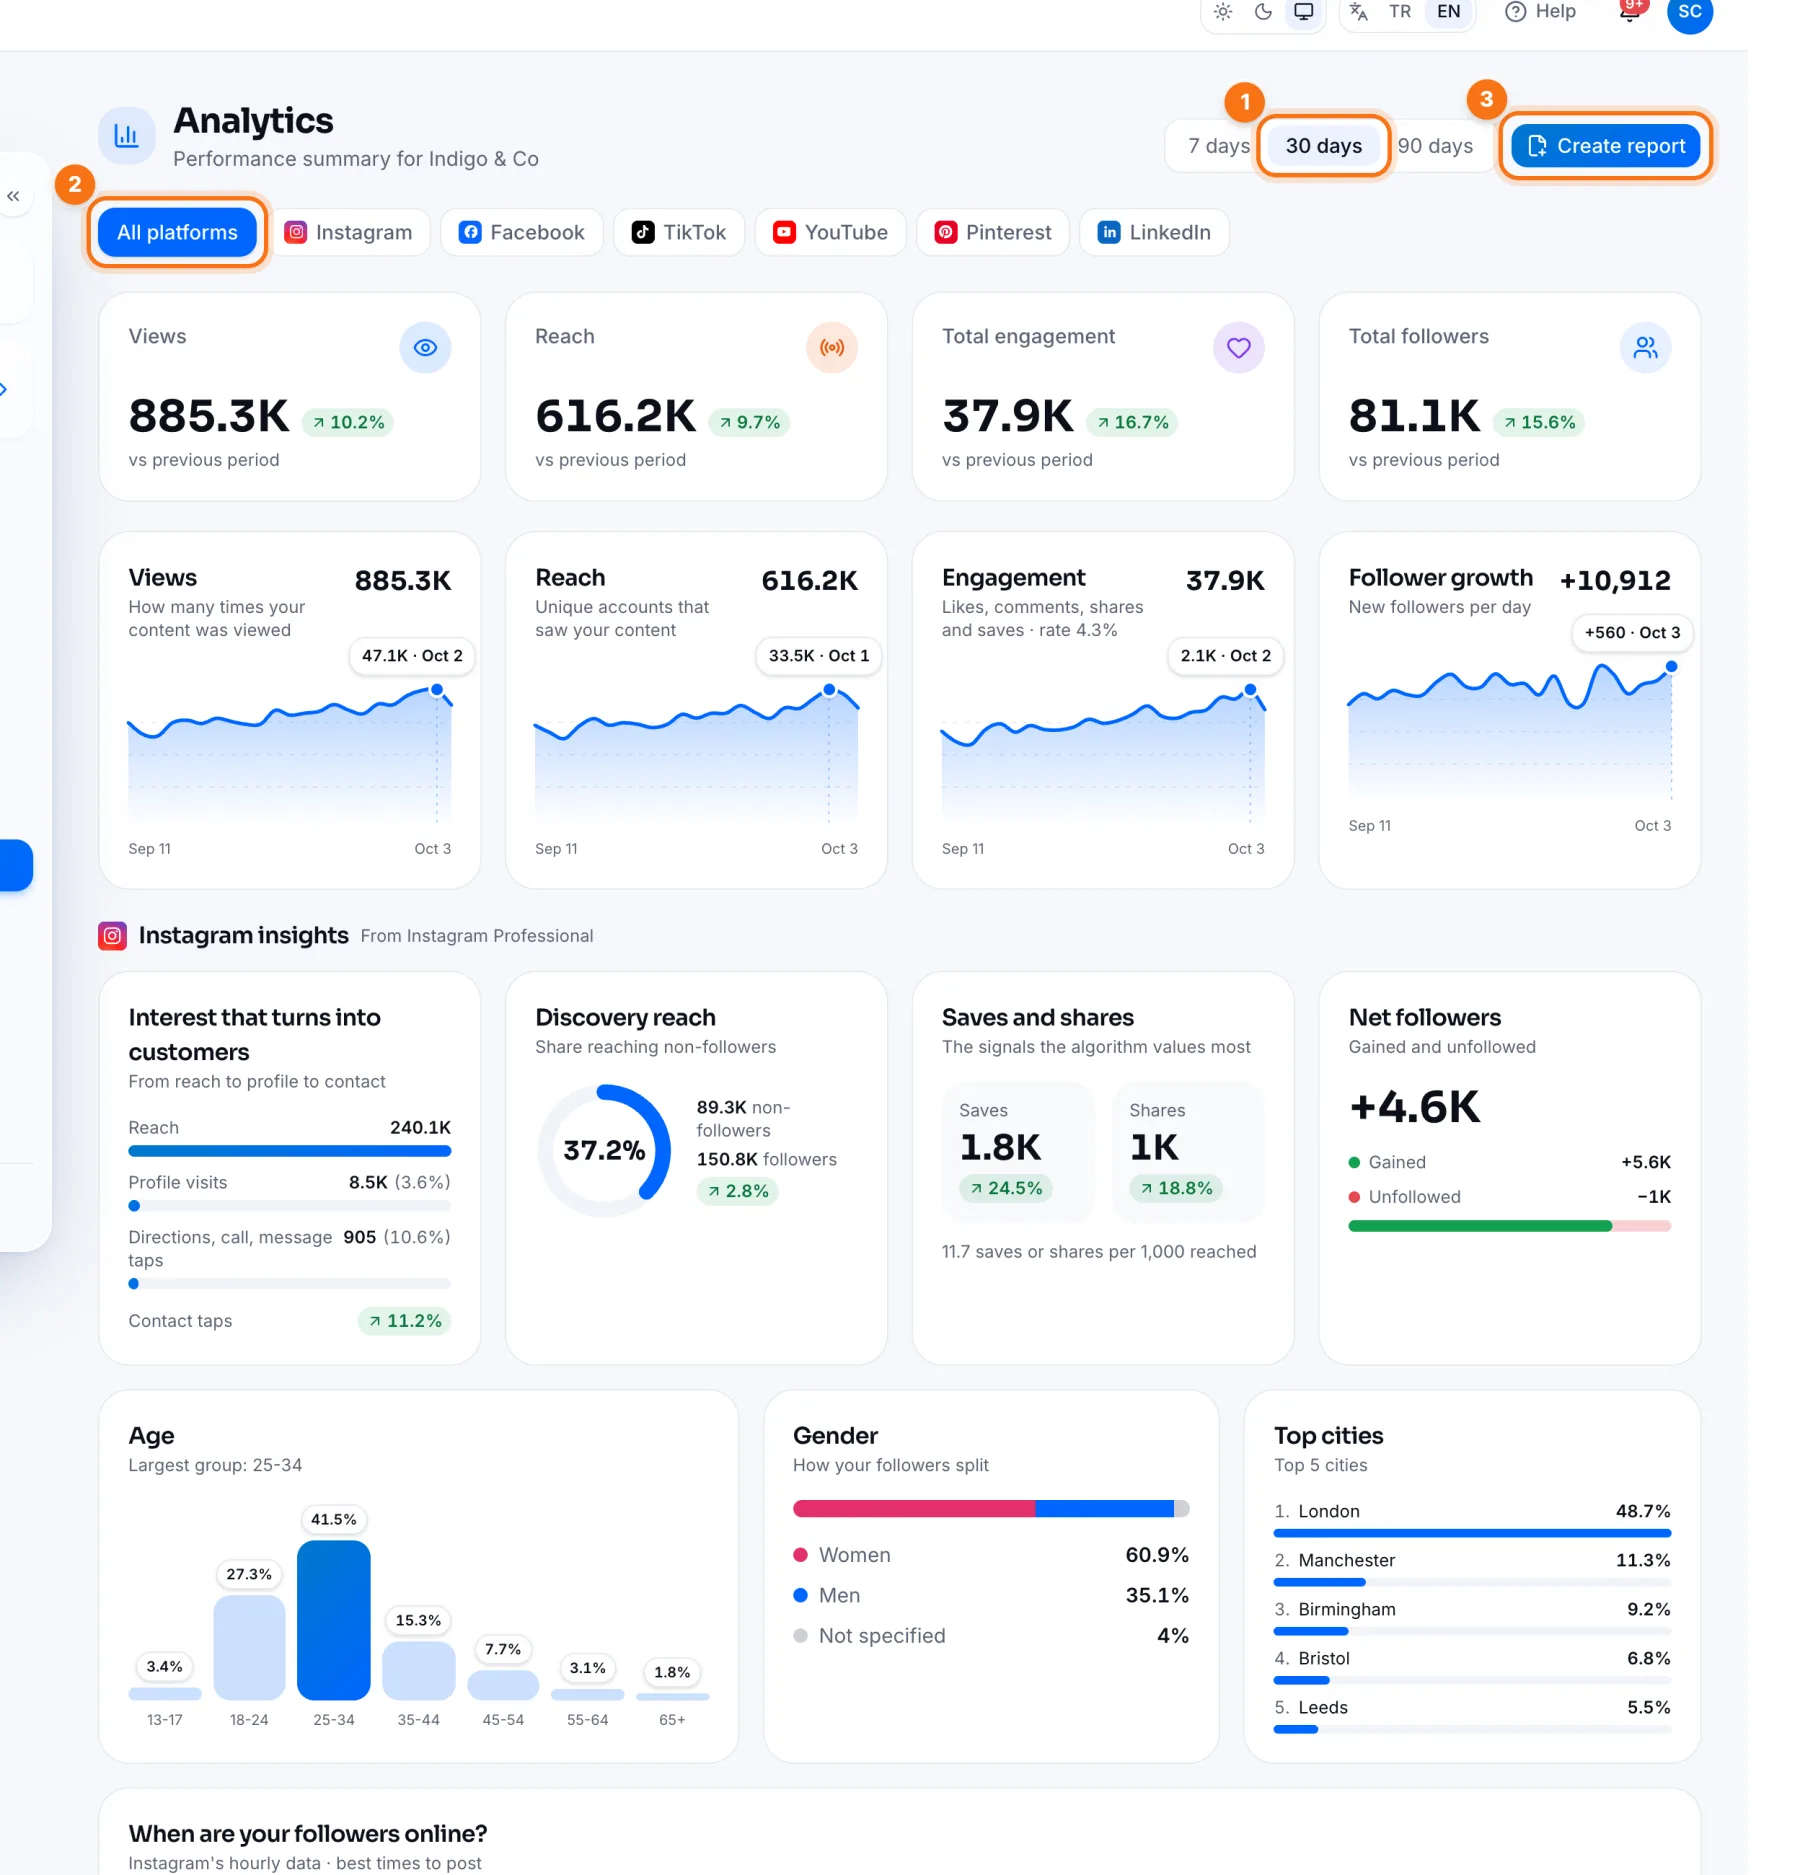
- 1Range: pick 7, 30 or 90 days. Every number is compared with the previous period of the same length.
- 2Platform: all platforms together or just one.
- 3Create report: turns the selected period into a saved report. See Reports.
What each section tells you
- Views, reach, engagement, followers: the four main numbers with daily charts.
- Instagram insights: profile visits, explore reach (people who don't follow you), saves and shares, net follower change; age, gender and city breakdown.
- When are your followers online?: a heat map by day and hour. The darkest boxes are the best times to post.
- Reels performance: Reels views, average watch time and the share of viewers who stay past 3 seconds.
- Platform performance: each platform's followers, engagement and share of views.
Look at the 30-day trend rather than one post going well or badly. If saves and shares are rising, you're on the right track. We explain why in Reels' 3 signals.
Frequently asked questions
Why do numbers differ slightly from the platform's?
Platforms update their data at different times and round some numbers. Small differences are normal; the trend is the same.